
Understanding how your HSC results are calculated
How many times have you seen students and teachers struggle to understand or explain the complex HSC and ATAR mark calculation system? Luckily, I’m here to break down in simple terms how your HSC results are calculated.
If you’re not interested in the fine details of how your results are calculated, feel free to jump ahead to the end where I share some key strategies to help use this information to your advantage.
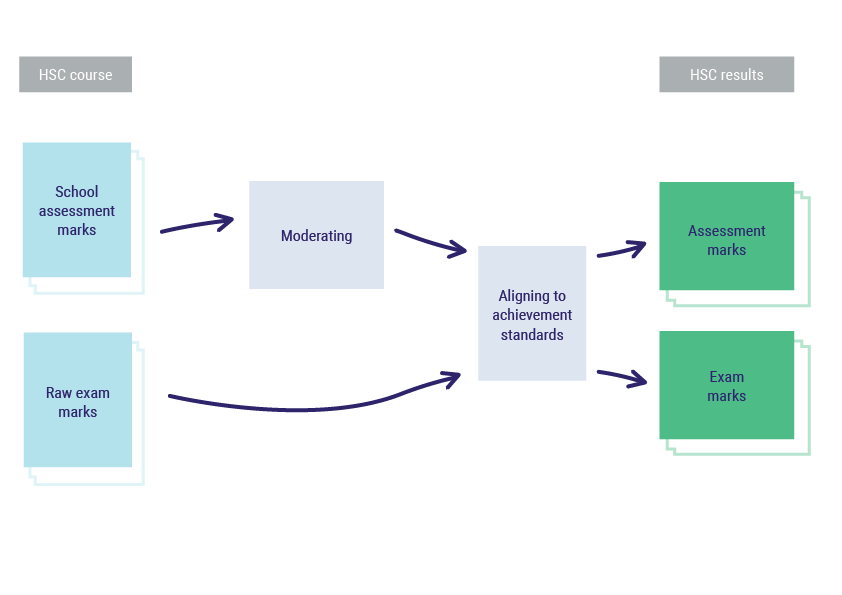
As shown in the diagram below, your HSC results consist of your assessment marks and exam marks, averaged to give your final HSC course result. At face-value, it would intuitively seem that assessment marks and exam marks have an equal 50:50 weighting: that’s true to some extent, but to get the full picture we need to drill down further.
Let’s start with the exam component:
NESA specifies performance bands in each subject, with Band 6 usually being the highest level of achievement (E4 in extension subjects). These bands each have a description of the type of knowledge, skills and understanding required of students at each level.
After all the HSC exams have been marked, NESA employs a ‘judging team’ to determine the minimum cut-off raw mark needed in each exam to qualify for each performance band. The cut-off marks are then use to align students’ raw marks so that they sit in the performance bands (e.g. Band 6 results are always aligned to the 90-100 range). For the sake of example, let’s assume the cut-off marks for a hypothetical course are 82 for Band 6 and 74 for Band 5:
- A student whose raw exam mark was 82, just meeting the standard for Band 6, would receive an exam mark of 90 on their HSC.
- A student whose raw exam mark was 74, just meeting the standard for Band 5, would receive an exam mark of 80.
- A student whose raw exam mark was 78, halfway between the cut-off marks for bands 5 and 6, would receive an exam mark of 85.
NESA doesn’t publish these cut-off marks, and they vary from year to year (because exam papers and marking guidelines change). Also, there’s no quotas for the amount of students in each band, so that also changes from year to year. For some insight into the cut-off marks in previous years, you can have a look at rawmarks.info, a community-sourced database that shows how previous students’ marks have been aligned. An example of their data is presented below.
Mathematics Advanced (2019)
|
Mathematics Ext 2 (2019)
|
In the example above, a raw mark of 84 translated to an aligned mark of 92 for Maths Advanced in 2019, while the more difficult Maths Ext 2 only required a raw mark of 79 to be translated to a 92.
It’s a good idea to have a look at some of the performance band descriptors for previous cohorts here – this should provide some insight into what it takes to get a Band 6 in each subject.
Now let’s look at your school assessments:
Once you complete all your school assessments, your school will submit the final assessment mark to NESA. The submitted marks show both the rank order of students within a particular school/course group and the relative gaps between them.
Assessment marks for a course submitted from a particular school are produced under the same conditions so they can be compared. Therefore, all assessment marks that schools submit are adjusted by NESA using a process called moderation, allowing for the assessment marks from all schools in the state to be compared relative to a common scale: the final examination.
The moderation process adjusts submitted assessment marks using three points:
- The top assessment mark is moderated to equal the top exam mark achieved within that cohort.
- The average of the school’s assessment marks is moderated to equal the average of the exam marks achieved within that cohort.
- The bottom assessment mark is moderated to equal the bottom exam mark achieved within that cohort.
Have a look at the example of student assessment marks for a hypothetical course at some school in NSW – you will notice that the moderated school assessment marks are within the same “scale” as the examination marks (allowing them to be compared with students across the state) but maintain the rank order and relative gaps between students that was found in the assessment marks submitted to NESA (allowing student’s efforts during school assessments to be rewarded).
Finally, NESA averages the moderated school assessment mark and the aligned exam mark to produce your final HSC result – as shown in the diagram below:
So how does my ATAR get calculated?
After all of that, UAC (an organisation separate from NESA) takes NESA’s final HSC marks to calculate your ATAR. Despite what you may have heard, UAC scales down all HSC results (with the exception of students achieving near the top and in extremely difficult subjects). UAC actually scales down all subjects down (with the exception of students achieving near the top and in extremely difficult subjects). However, some subjects scale down more than others (usually the subjects perceived as easier, but this isn’t always a sure thing). So the perception about hard subjects like Maths Ext 2 and the sciences “scaling up” isn’t entirely true – what happens is when NESA aligns the marks to performance bands, they will usually have a lower cut-off for higher performance bands in the harder subjects. Feel free to have a look at UAC’s 2019 scaling data here.
TL;DR
The way that you interpret and understand the HSC marks calculation can impact how you strategize and plan your HSC year. For me, these are the salient lessons:
- Establish what is required of you to get a Band 6 in all your subjects – check out the performance band descriptors for previous cohorts here.
- Ace your school assessments to maintain a strong rank – ultimately this will take the pressure off of the final exam and you should try and grab every easy mark you can. Also, the new HSC assessment rules mean that your assessments during the year are likely to be weighted more equally to your trial, meaning that consistent work throughout the year will pay off.
- You all do better if you all do better – the way the assessment mark moderation process works means that if a cohort of students at the same school perform well in an exam, they can have a positive influence on each other’s marks (although if everyone performs poorly there will be a negative influence). That’s why it’s important to help your peers rather than compete, especially after your school assessments are over. For that reason we offer $40 credit if you refer a friend, so you can maximise your marks together.
- The final exam counts for more than its 50% share – since assessment marks are moderated based on exam marks, the exam actually has a heavier influence on your final result (its uncommon to find widely disparate school assessment marks and exam marks amongst student HSC results).
We’ve got a team of experts that are well-versed in approaching the HSC with careful strategy and planning – if you’re having trouble actioning any of this advice, don’t hesitate to get in touch so we can provide you some support.


Leave a Reply
Want to join the discussion?Feel free to contribute!